ppcdude.com

Advanced PPC

Python / Pandas for PPC – Part 2: Import a CSV from AdWords

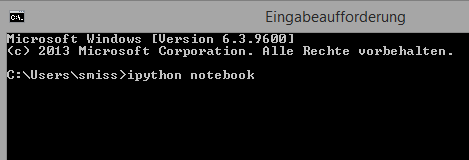
In the previous posting you learned how to set up your iPython notebook environment based on Anaconda. Now we want to import data from AdWords into the tool.

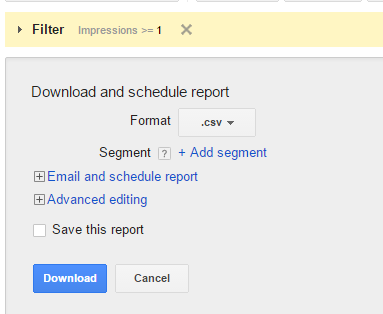
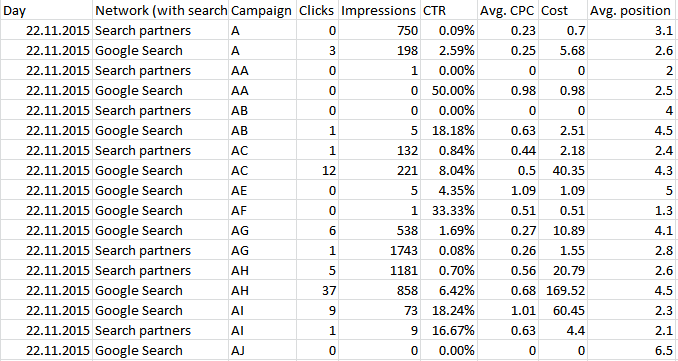
First, download a keyword report from AdWords. For this tutorial I use a report directly from the interface. Of course you can import reports from the MCC level as well. Make sure to set the format to “.csv” instead of the default “Excel .csv”:

Keyword Report CSV Setting

Now add this code into your iPython Notebook:

Cell 1:

Cell 2:

This block of code is a “function”. Functions are a way of structuring your program. It is a good programming practice to use functions whenever you plan to use a block of code more than once in your program. A function takes some input as arguments and it returns some output. Our function “fimport” takes these arguments:

  • path: The path to your .csv file.
  • filename: The name of the .csv file.
  • sep: CSV separator. AdWords files are delimited by comma.
  • encoding: The file’s encoding. AdWords files are encoded in “utf-8”.
  • skiprows: How many rows should be skipped from the top of the file? If you downloaded directly from the interface there will be one row that contains the timeframe.
  • header: The row that contains the column headers.

fimport in this version can not just load one file. It is able to even import several similarly structured .csv files alltogether. Then it concatenates these files into one big table. That’s why you can see a for … in loop in the script.

Running just the cell which contains the function just loads the function definition into Python. But it did not do more. To achieve anything with it, we need to call the function:

Cell 3:

The first three lines set the path and filename. The replace method I used here replaces Backslashes with Slashes. This is only needed if you use iPython in a Windows environment. Otherwise you can remove that line. In line 5 we finally call the import function fimport with just the two arguments for encoding and for skiprows. If you do not set the other arguments then the default is taken from the function definition. “df” is our “DataFrame” (that is basically Pandas name for a table). You could have named that differently (e.g. “keywords” or “kw”) but I stick to the common “df”.

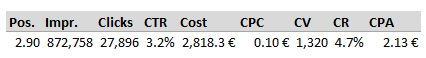
Now we can have a look how our imported table looks like. Just enter “df” into a new cell an run it with Ctrl+Enter:

Pandas DataFrame

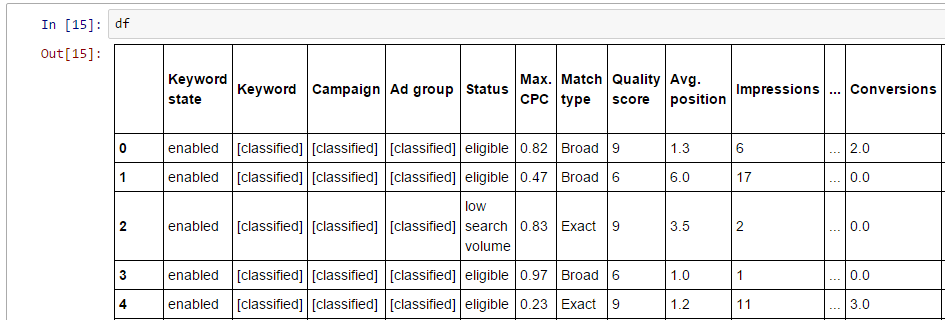
Pandas shows the table. You can see all your keywords and their performance data.

In the next posting I will show you how to work with that table. How to slice and modify the data and re-export it later in a new .csv.

(Title Image: Creative Commons 3.0)

Python / Pandas for PPC – Part 1: Set Up the iPython Notebook

Why Python / Pandas?

If you do Search PPC in e-commerce or for clients in the travel industry you know how fast you get to account sizes that go far beyond Excel’s 1 Million rows limit. And even if you are way below that number regarding your keyword portfolio, at some point you might want to analyze data with different segments for device, search network, over weeks, days or even on hourly basis. If your account has only 10.000 keywords with Impressions and you want to do a timeseries analysis on this data for just over the last 10 days, segmented by day then you already get to Excel’s limit’s.

Besides from that, Excel tends to slow down even with less data. Simple calculations can take minutes and Search & Replace runs cell by cell to do a simple operation like “Replace X with Y”. We got used to this taking time just because we don’t know other ways. Many PPC managers complain that their computer is just too slow.

But it is not the computer to blame. It is Excel and its algorithms. The tool is just not made for large-scale PPC operations which could actually be done much better in a real database environment. Excel’s default algorithms are made for an interactive GUI frontend that Excel is. The truth is: If your computer used a different algorithm of working with the data the calculation would speed up by  10 to 1000 times.

The combination of the Python programming language combined with the Pandas library is a very good alternative to working with Excel on large datasets. Python alone would not really help you as you would need to write the necessary code to do all the usual tasks that you handle in Excel now completely from scratch. Probably these would be even slower than Excel. This is where Pandas enters the stage:

pandas is an open source, BSD-licensed library providing high-performance, easy-to-use data structures and data analysis tools for the Python programming language. (Pandas Website)

Critical parts of the code that usually lead to slow performance are witten in “C”. The library is extremely fast. Fast enough for all the tasks you struggle in Excel with.

The other argument for Python / Pandas in PPC besides from speed is repetitiveness. What you do in Pandas is real programming. Your can write complete programs doing your daily boring tasks. In the beginning you might need more time than doing all the steps once in Excel. But as soon as you have finished your program in Pandas, you are able to run in on another input file in a week again without doing any of the steps before. Additionally you can send the script to your colleague and he can also run the script on his computer to do the task on his accounts.

With Pandas you can do all the tasks a PPC manager has to deal with:

  • Build full accounts from scratch.
  • Create, remove and change ads and keywords in existing accounts.
  • Aggregate and analyze large sets of data.
  • Create Graphs and tables.

Install Anaconda

For this tutorial we are going to use the easy-to-setup Python platform Anaconda. Anaconda includes all necessary libraries we need to use Python for PPC. Download the platform for Python 2.7 from the website and install it on your computer. There are versions for Windows, OSX and Linux available.

The iPython interface

After installing Anaconda, open a terminal. In Windows you can find the Termial by pressing “Alt + R” and entering “cmd”.

Run iPython Notebook

Your browser will open a new tab with an iPython notebook. This is our development environment.

Pandas Hello World

The Notebook consists of “cells”. A cell defines one block of code. Each cell can be run either completely from top to the bottom of your program or individually one by one. You can copy, paste, modify, merge, split or move cells around in your program. Enter ‘hello world’ (with Apostrophs!) into the first cell and press “Shift + Enter”. Python runs the cell and shows the output. Below a new cell is created. Enter the code shown in the screenshot and hit “Ctrl + Enter”. Now this cell gets run without creating a new cell.

The possibilities of manipulating cells can lead to much faster development of scripts. Imagine this:

You want to write a small script which creates a new column in your downloaded data from AdWords. This column contains some label you want to set according to the campaign name.

Cell 1: Code to import the necessary libraries.
Cell 2: Code to import the CSV you downloaded from AdWords.
Cell 3: Function to add the new column and put a label according to the campaign name.
Cell 4: Export the data to a CSV file for importing into AdWords Editor.

After running the program and importing into AdWords Editor you notice a mistake. You accidentially included some campaigns into your labeling that are Test Campaigns. But these should not get the label.

In iPython you do not need to run the full program again in that case. You can just change Cell 2 and add one line of code to it, which excludes the Test campaigns. Alternatively you might add a new cell between Cell 2 and Cell 3 with the code to exclude. Then you just run Cell 2 up to the last cell. Done.

This is just a very simple example. If you create bigger scripts that do many different operations to your data, you might find this kind of development in iPython much faster than the traditional method with just a text file.

In the next part of this series learn how to import AdWords data into your iPython notebook.

(Title Image: Creative Commons 3.0)

VBA Macro to Create Pivot Tables from AdWords Reports

How often do you use Pivot tables created from AdWords data? Several times a day, every day? Even if you create a Pivot table from AdWords reports only once a week you probably get as annoyed as me to always have to create the necessary calculated fields for CTR, Conversion Rate, CPC etc.

Let’s say you like to view performance of Google Search vs. Search Partners on a daily basis for all of your campaigns. Sure, you could use the new Report Editor for this task, but you will get into trouble if you manage large scale PPC accounts that spread over more than one account in an MCC environment. Unfortunately the Report Editor is not available for the MCC level, yet. We need to use the MCC reports in that case. But these can only be downloaded as an Excel or CSV-file. Aggregation of the data needs to be done in a Pivot table to actutally see trends.

Manual Pivot Creation

Usually you might create the Pivot table with the following steps all manually:

Download the report and open it in Excel. The report might look like this:

AdWords Campaign Report

For position to be calculated correctly (weighted by Impressions instead of taking the mean) in a Pivot table you need to add an additional helper column to your original data:

AdWords Campaign Report: Position Helper Column

Then you select the table and create a privot table:
AdWords Campaign Report Pivot Table

Create all necessary calculated fields:

Pivot Calculated Field: CTR

Then you see that Excel does not format numbers in a reasonable way:

AdWords Pivot Table: Number Formatting

Now you need to click on all of your current metrics and change their formatting:

AdWords Pivot Table: Number Formatting Percentage

If your are fast, you can do all of the above steps in around five minutes. But why not use a VBA macro to full automatize these steps? The idea here is not only to save you some time but to also enable you to do more quick analysis.

The Code for doing it automatically:

Install the code

  1. Copy the code.
  2. In Excel press “Alt + F11” to open the VBA editor.
  3. Create a new Module in your current workbook.
  4. Paste the code into the module (If you already set up Excel’s highly recommended PERSONAL.XSLB file paste the code into a module in that file to have the macro available in all of your Worksheets. See Microsoft’s Support page on how to set up PERSONAL.XLSB)

How to use the code

  1. Download a report from AdWords with at least these metrics:
    • Impressions
    • Clicks
    • Conversions
    • Cost
    • Average Position
  2. Your report’s column names need to be English.
  3. All column headlines need to be in the first row: Delete all rows above the column headlines (usually that is one row in a report directly downloaded from the interface and five rows if you got the report from MCC report center).
  4. Delete the “Total columns” at the end of the report.
  5. Press “Alt + F8” to open the Macro overview.
  6. Run the macro.
  7. The result will be a new Sheet with a pivot table fully formatted and with all necessary columns and calculated fields:
    Adwords Pivot Macro Result

From this point on you can easily put Dimensions or other useful metrics into your Pivot table.

© 2024 ppcdude.com

Up ↑