How often do you use Pivot tables created from AdWords data? Several times a day, every day? Even if you create a Pivot table from AdWords reports only once a week you probably get as annoyed as me to always have to create the necessary calculated fields for CTR, Conversion Rate, CPC etc.
Let’s say you like to view performance of Google Search vs. Search Partners on a daily basis for all of your campaigns. Sure, you could use the new Report Editor for this task, but you will get into trouble if you manage large scale PPC accounts that spread over more than one account in an MCC environment. Unfortunately the Report Editor is not available for the MCC level, yet. We need to use the MCC reports in that case. But these can only be downloaded as an Excel or CSV-file. Aggregation of the data needs to be done in a Pivot table to actutally see trends.
Manual Pivot Creation
Usually you might create the Pivot table with the following steps all manually:
Download the report and open it in Excel. The report might look like this:
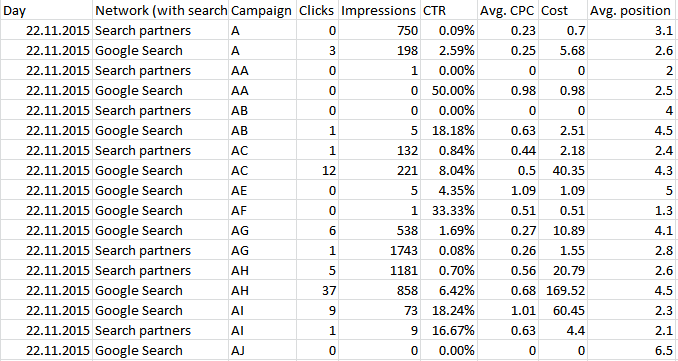
For position to be calculated correctly (weighted by Impressions instead of taking the mean) in a Pivot table you need to add an additional helper column to your original data:

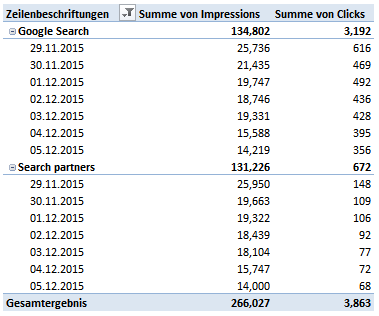
Then you select the table and create a privot table:
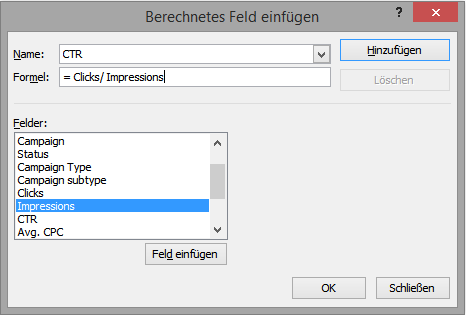
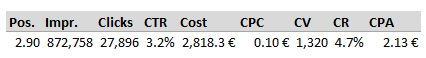
Create all necessary calculated fields:
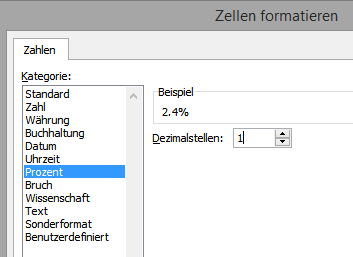
Then you see that Excel does not format numbers in a reasonable way:
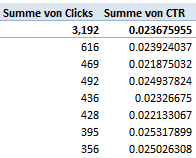
Now you need to click on all of your current metrics and change their formatting:
If your are fast, you can do all of the above steps in around five minutes. But why not use a VBA macro to full automatize these steps? The idea here is not only to save you some time but to also enable you to do more quick analysis.
The Code for doing it automatically:
|
1 2 3 4 5 6 7 8 9 10 11 12 13 14 15 16 17 18 19 20 21 22 23 24 25 26 27 28 29 30 31 32 33 34 35 36 37 38 39 40 41 42 43 44 45 46 47 48 49 50 51 52 53 54 55 56 57 58 59 60 61 62 63 64 65 66 67 68 69 70 71 72 73 74 75 76 77 78 79 80 81 82 83 84 85 86 87 |
Sub MakePivot_eng() Dim poscol As Boolean Dim rngImpressions As Range Dim rngPos As Range Dim lastRow As Long lastRow = Range("A" & Rows.Count).End(xlUp).Row Set Source = ActiveSheet.Range("A1").CurrentRegion Set Header = Source.Rows(1) 'Set up the helper column to calculate Weighted Average Position 'Check if the helper column is already available and find it's position For Each c In Header.Cells Select Case c Case "Pos*Imp" bPoscol = True Case "Impressions" Set rngImpressions = c Case "Avg. position" Set rngPos = c End Select Next c 'Create the helper column if it is not available If bPoscol = False Then Source.Range("A1").EntireColumn.Insert ActiveSheet.Range("A1").Value = "Pos*Imp" ActiveSheet.Range("A2").FormulaLocal = "=" & rngImpressions.Offset(1, 0).Address(False, False) & "*" & rngPos.Offset(1, 0).Address(False, False) ActiveSheet.Range("A2:A" & lastRow).FillDown Set rPoscol = ActiveSheet.Range("A1") Set Source = ActiveSheet.Range("A1").CurrentRegion End If 'Add a new sheet for the Pivot Table Sheets.Add Set ps = ActiveSheet.Range("A1") 'Create the Pivot Table from the source data ActiveWorkbook.PivotCaches.Create(SourceType:=xlDatabase, SourceData:= _ Source, Version:=xlPivotTableVersion14).CreatePivotTable _ TableDestination:=ps, TableName:="PivotTable20", _ DefaultVersion:=xlPivotTableVersion14 ActiveSheet.PivotTables(ActiveCell.PivotTable.Name) = "PivotTable1" Set pt = ActiveSheet.PivotTables("PivotTable1") 'Calculate and add the metrics pt.CalculatedFields.Add "Pos", "='Pos*Imp'/Impressions", True pt.PivotFields("Pos").Orientation = xlDataField pt.PivotFields("Sum of Pos").Caption = "Pos. " pt.AddDataField pt.PivotFields("Impressions"), "Impr. ", xlSum pt.AddDataField pt.PivotFields("Clicks"), "Clicks ", xlSum pt.CalculatedFields.Add "CTR_", "=Clicks /Impressions", True pt.PivotFields("CTR_").Orientation = xlDataField pt.PivotFields("Sum of CTR_").Caption = "CTR " pt.AddDataField pt.PivotFields("Cost"), "Cost ", xlSum pt.CalculatedFields.Add "CPC_", "=Cost /Clicks", True pt.PivotFields("CPC_").Orientation = xlDataField pt.PivotFields("Sum of CPC_").Caption = "CPC " pt.AddDataField pt.PivotFields("Conversions"), "CV ", xlSum pt.CalculatedFields.Add "CR_", "=Conversions /Clicks", True pt.PivotFields("CR_").Orientation = xlDataField pt.PivotFields("Sum of CR_").Caption = "CR " pt.CalculatedFields.Add "CPA_", "=Cost /Conversions", True pt.PivotFields("CPA_").Orientation = xlDataField pt.PivotFields("Sum of CPA_").Caption = "CPA " 'Formatting pt.PivotFields("Cost ").NumberFormat = "#,##0.0 €" pt.PivotFields("CTR ").NumberFormat = "0.0%" pt.PivotFields("CPA ").NumberFormat = "#,##0.00 €" pt.PivotFields("CR ").NumberFormat = "0.0%" pt.PivotFields("Impr. ").NumberFormat = "#,##0" pt.PivotFields("Clicks ").NumberFormat = "#,##0" pt.PivotFields("CV ").NumberFormat = "#,##0" pt.PivotFields("Pos. ").NumberFormat = "#.#0" pt.PivotFields("CPC ").NumberFormat = "#,##0.00 €" 'pt.PivotFields("CRR ").NumberFormat = "0.00%" 'Layout and Settings pt.TableStyle2 = "PivotStyleLight15" pt.HasAutoFormat = False pt.DisplayContextTooltips = False End Sub |
Install the code
- Copy the code.
- In Excel press “Alt + F11” to open the VBA editor.
- Create a new Module in your current workbook.
- Paste the code into the module (If you already set up Excel’s highly recommended PERSONAL.XSLB file paste the code into a module in that file to have the macro available in all of your Worksheets. See Microsoft’s Support page on how to set up PERSONAL.XLSB)
How to use the code
- Download a report from AdWords with at least these metrics:
- Impressions
- Clicks
- Conversions
- Cost
- Average Position
- Your report’s column names need to be English.
- All column headlines need to be in the first row: Delete all rows above the column headlines (usually that is one row in a report directly downloaded from the interface and five rows if you got the report from MCC report center).
- Delete the “Total columns” at the end of the report.
- Press “Alt + F8” to open the Macro overview.
- Run the macro.
- The result will be a new Sheet with a pivot table fully formatted and with all necessary columns and calculated fields:
From this point on you can easily put Dimensions or other useful metrics into your Pivot table.
Recent Comments